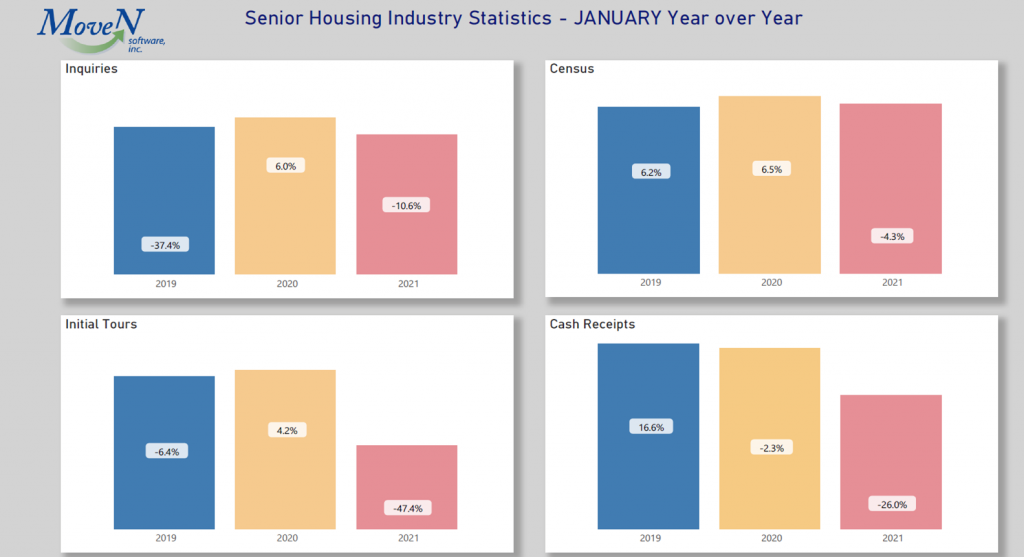
With 2020 now behind us and vaccines being administered, we are thankfully looking at bringing this pandemic to an end. Until that happens, we will continue to provide comparative analysis for you to evaluate your performance metrics. The graphs will now contain year over year comparisons for 2019, 2020 and 2021. 2019 figures are year over year comparison to 2018.
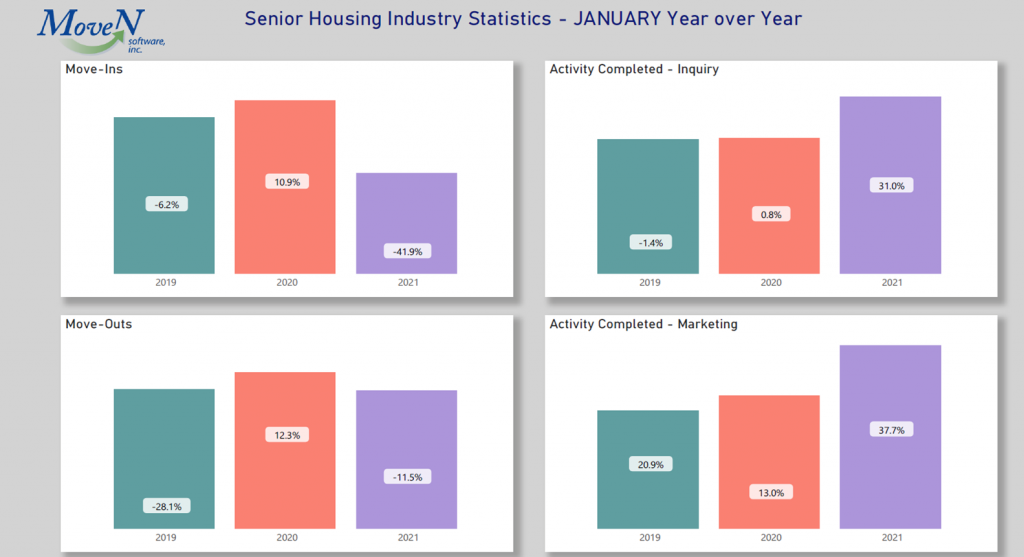
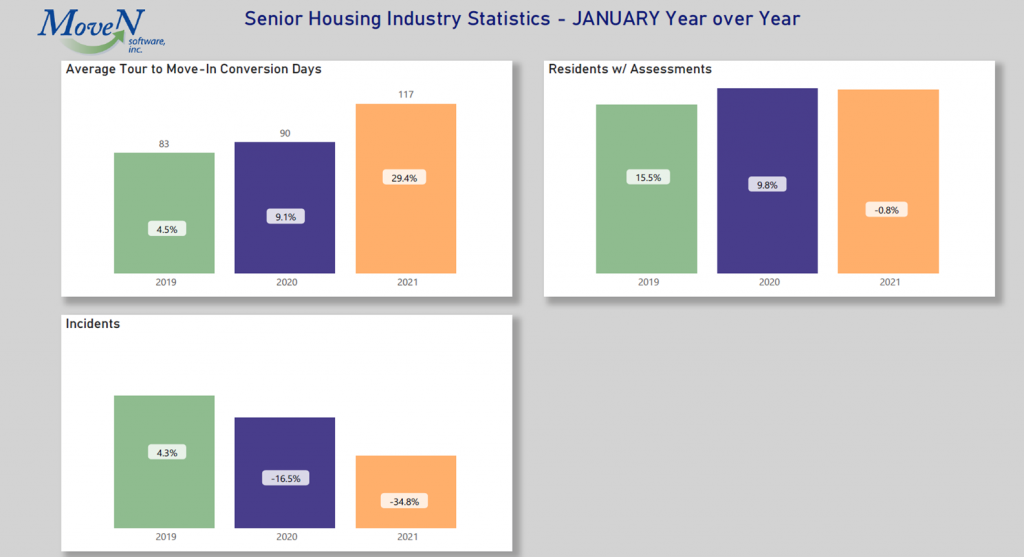
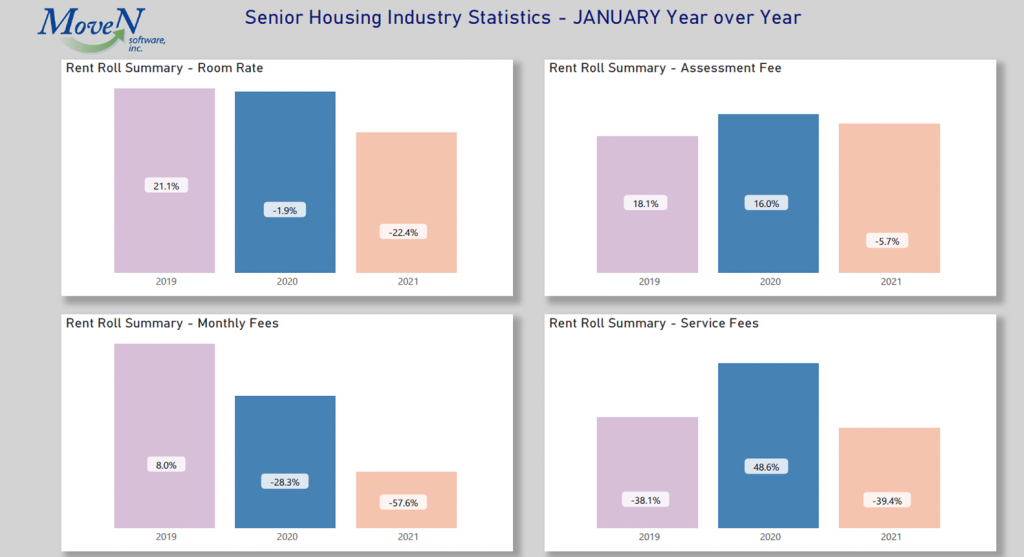
As expected, the year-over-year comparisons for January show declines in all areas, except for outreach activity. Prior to the pandemic, the number of leads and tours had actually increased in January 2020 vs the same period in 2019, but compared to 2020, this January showed a small decline in leads, but a significant downturn in tours. The census decline that began in 2020 has carried over into January of this year, after census increases in both January 2019 and 2020. There was also a large drop in move-ins this year compared to 2020. The number of days to convert tours to move-ins has increased by almost 30%, while rent revenues are down by over 22% vs same period last year.
These graphs contain year over year comparisons for 2019, 2020 and 2021. Please note that 2019 figures are year over year comparison to 2018.