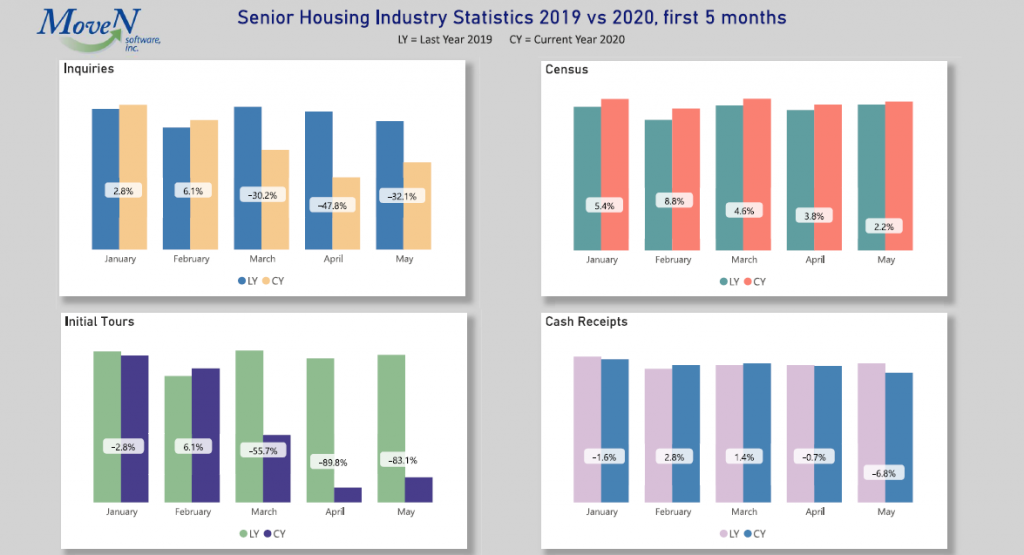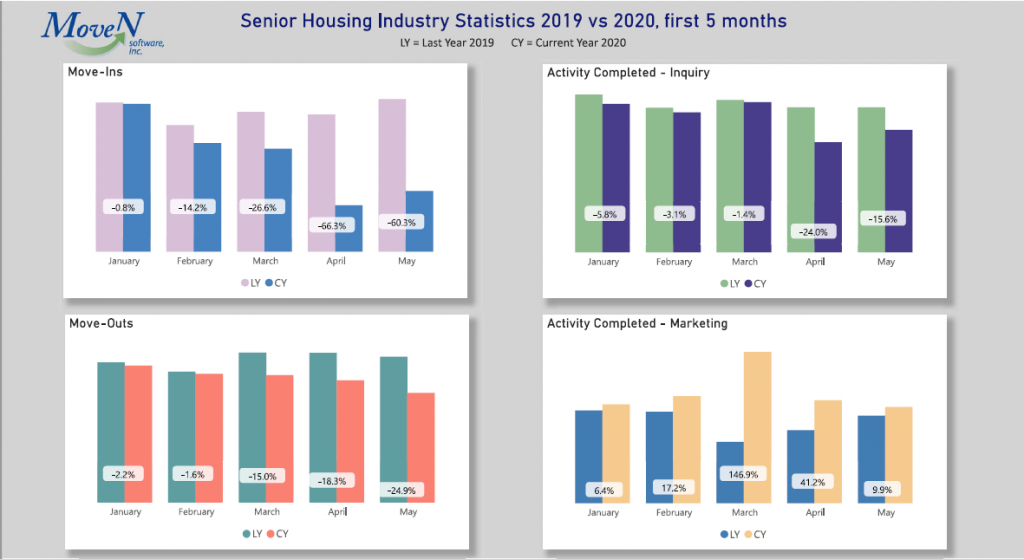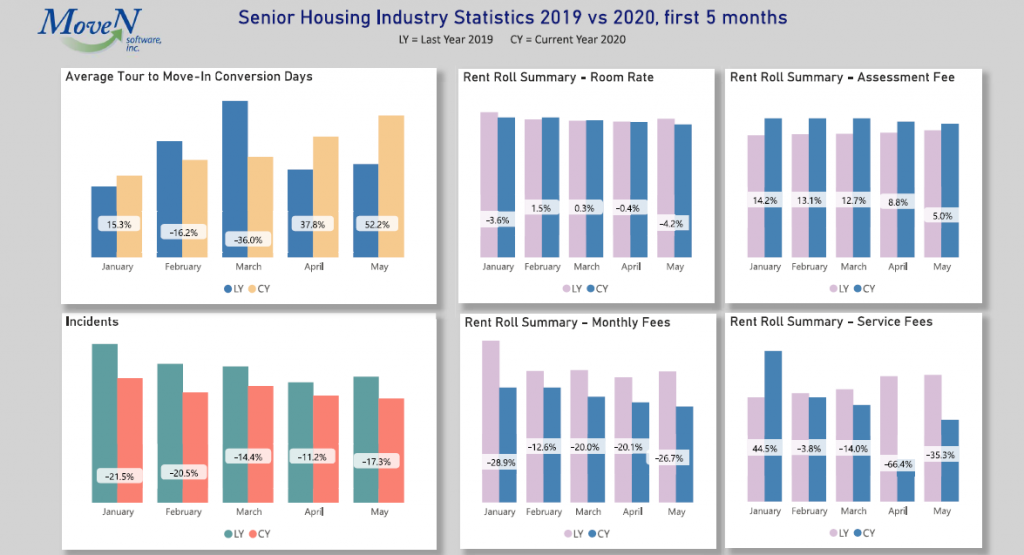
In response to requests from our customers on how their company performance is comparing to our other customers, of the communities in our database, we pulled together a sampling of data from large, mid-size and smaller markets across the United States and Canada, and compiled month to month statistics comparing 2019 vs. 2020 to get a sense for the pandemic influence on the overall industry. As expected, you will see across the industry that inquiries, move-ins, and initial tours dropped significantly during the COVID-19 crisis. Another interesting statistic we discovered (not pictured in the graphs) is that initial tours take an average of 178 days to convert to move-in. Again, that is for those communities we polled nationwide. If that is the case for your buildings as well, one might expect that with the drop in inquiries, tours, and move-ins, during March, April, and May, if there hasn’t been a census drop yet, there may be a drop later in 2020. There was also a decrease in move-outs which could possibly be because people did not want to move during COVID-19 and are waiting until the crisis is over before making a change.